Case Study: Full Circle Music Festival - Introducing Heat Map Data for Enhanced Visitor Experience
Published on November 17, 2023
Full Circle is a well-known three-day music festival in Antwerp, Belgium, featuring 35 venues and over 150 artists. With around 20,000 visitors, managing crowd flow efficiently was a key challenge for the organizers. They wanted a way to provide attendees with real-time updates on venue capacities, helping them make better decisions about where to go next.
The Challenge
With multiple venues spread across the city, festival-goers often encountered fully occupied locations or had to wait in long queues. Organizers needed a solution to monitor venue capacities in real time and communicate this information to the audience. Additionally, they wanted to gain deeper insights into crowd movements for safety and event planning purposes.
The Solution
To tackle this challenge, we collaborated with Full Circle to develop Live Zone Attendance, a system that tracked venue capacities and visitor movements in real time.
1. Wristbands with QR Codes
Each attendee received a wristband with a unique QR code, linked to their ticket type in our accreditation system. These QR codes helped manage access control and provided an accurate count of people entering and leaving each venue.
2. Real-time Venue Tracking
In the five largest venues, dedicated scanning devices registered every entry and exit. This allowed us to monitor the number of attendees present at any given time.
3. Live Data Dashboard
We built a dashboard that displayed real-time venue capacities. Organizers could see which locations were nearing their limit, helping them manage crowds more effectively.
4. Heat Map Integration
The venue capacity data was fed into a publicly accessible heat map on the Full Circle website. This tool allowed attendees to check venue availability before deciding where to go next, reducing congestion and improving the overall festival experience.
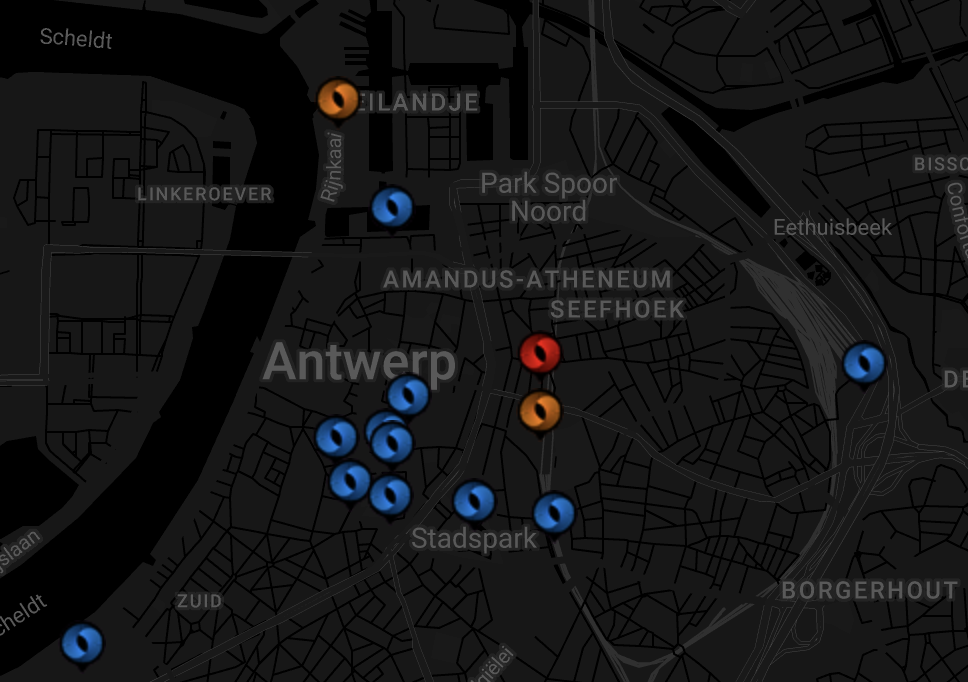
Heat Map visual created by Full Circle
Benefits and Impact
The implementation of the Heat Map feature resulted in significant positive outcomes for both festival organizers and attendees:
1. Better Experience for Visitors
With real-time information on venue capacities, festival-goers could avoid overcrowded spaces, reducing wait times and making their experience smoother.
2. Detailed Insights for Organizers
The scanning process provided the festival organizers with detailed information, including:
- Number of visitors at specific venues.
- Activation status of wristbands.
- Movement patterns of attendees between venues.
- Indication of peak hours
- Analysis of artist popularity influencing visitor movements.
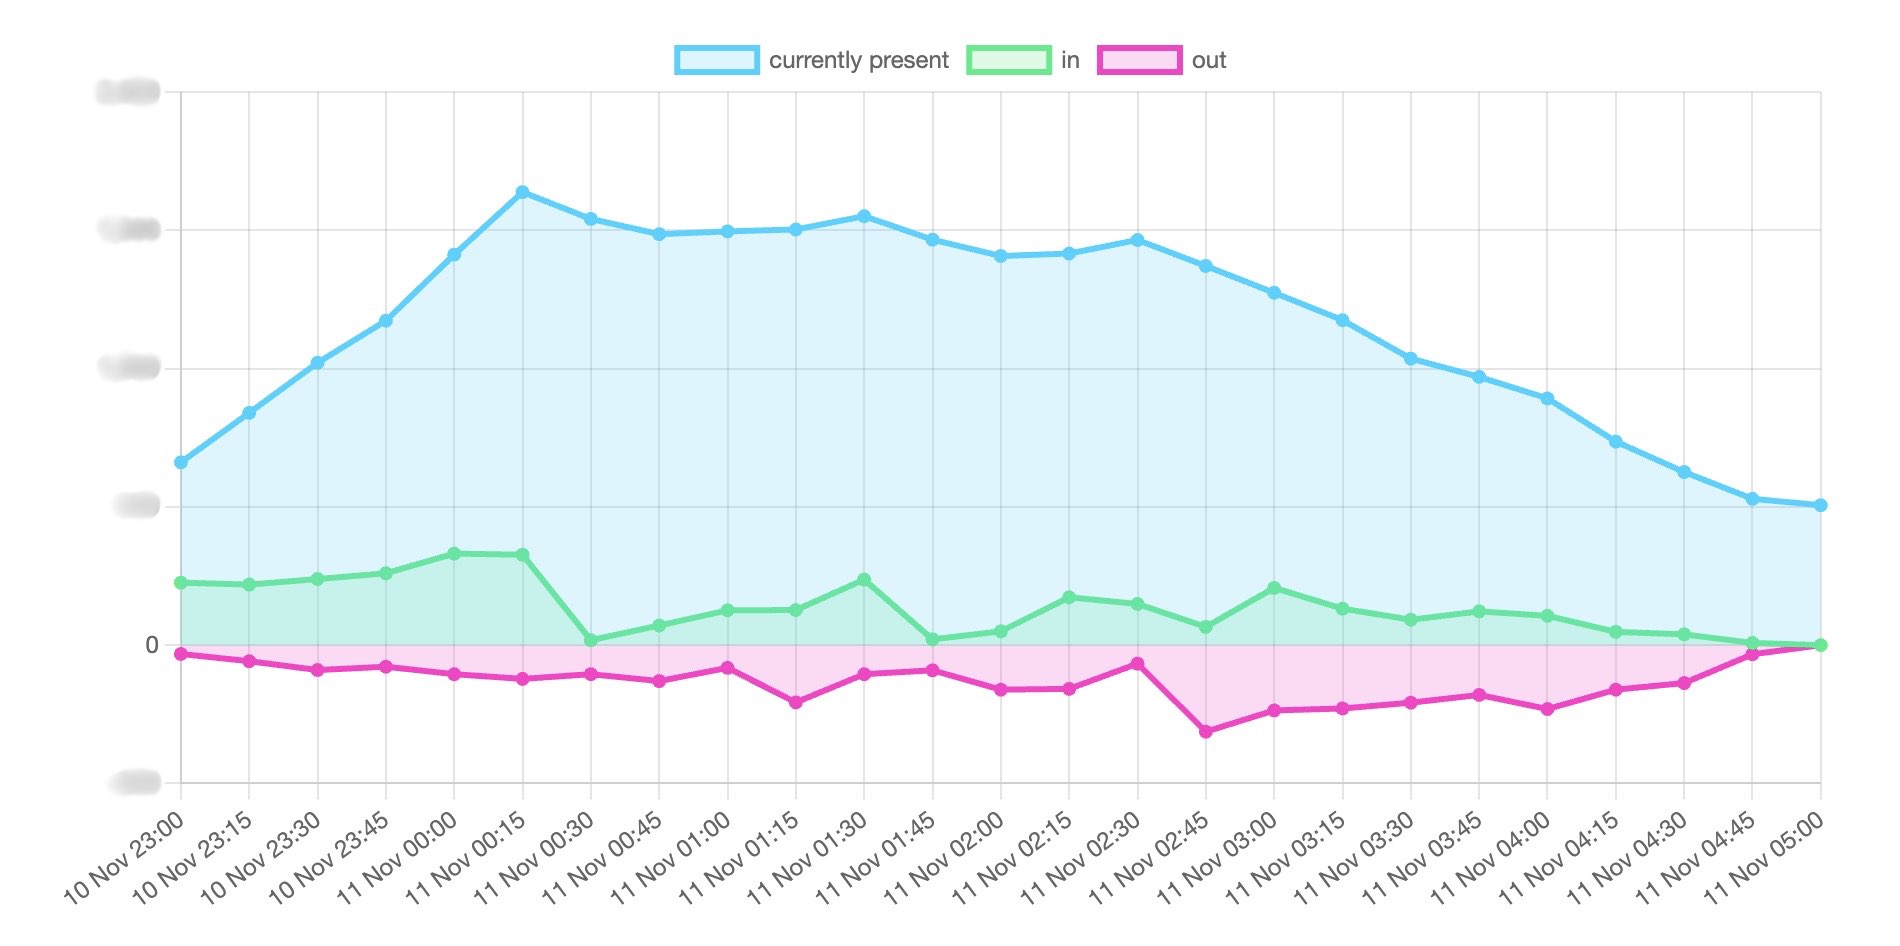 Data as shown on our moderator portal.
3. Safety
Having live data on venue capacities allowed organizers to make informed safety decisions. When a venue reached full capacity, they could take immediate action—such as redirecting attendees to other locations—to prevent overcrowding.
This collaboration between Full Circle and our team demonstrated how real-time data can enhance both crowd management and visitor experience. By using technology to make smart, data-driven decisions, the festival was able to run more efficiently and safely.
With continuous improvements, this system could become a standard tool for multi-venue festivals, helping organizers optimize event logistics while giving attendees a smoother and more enjoyable experience.
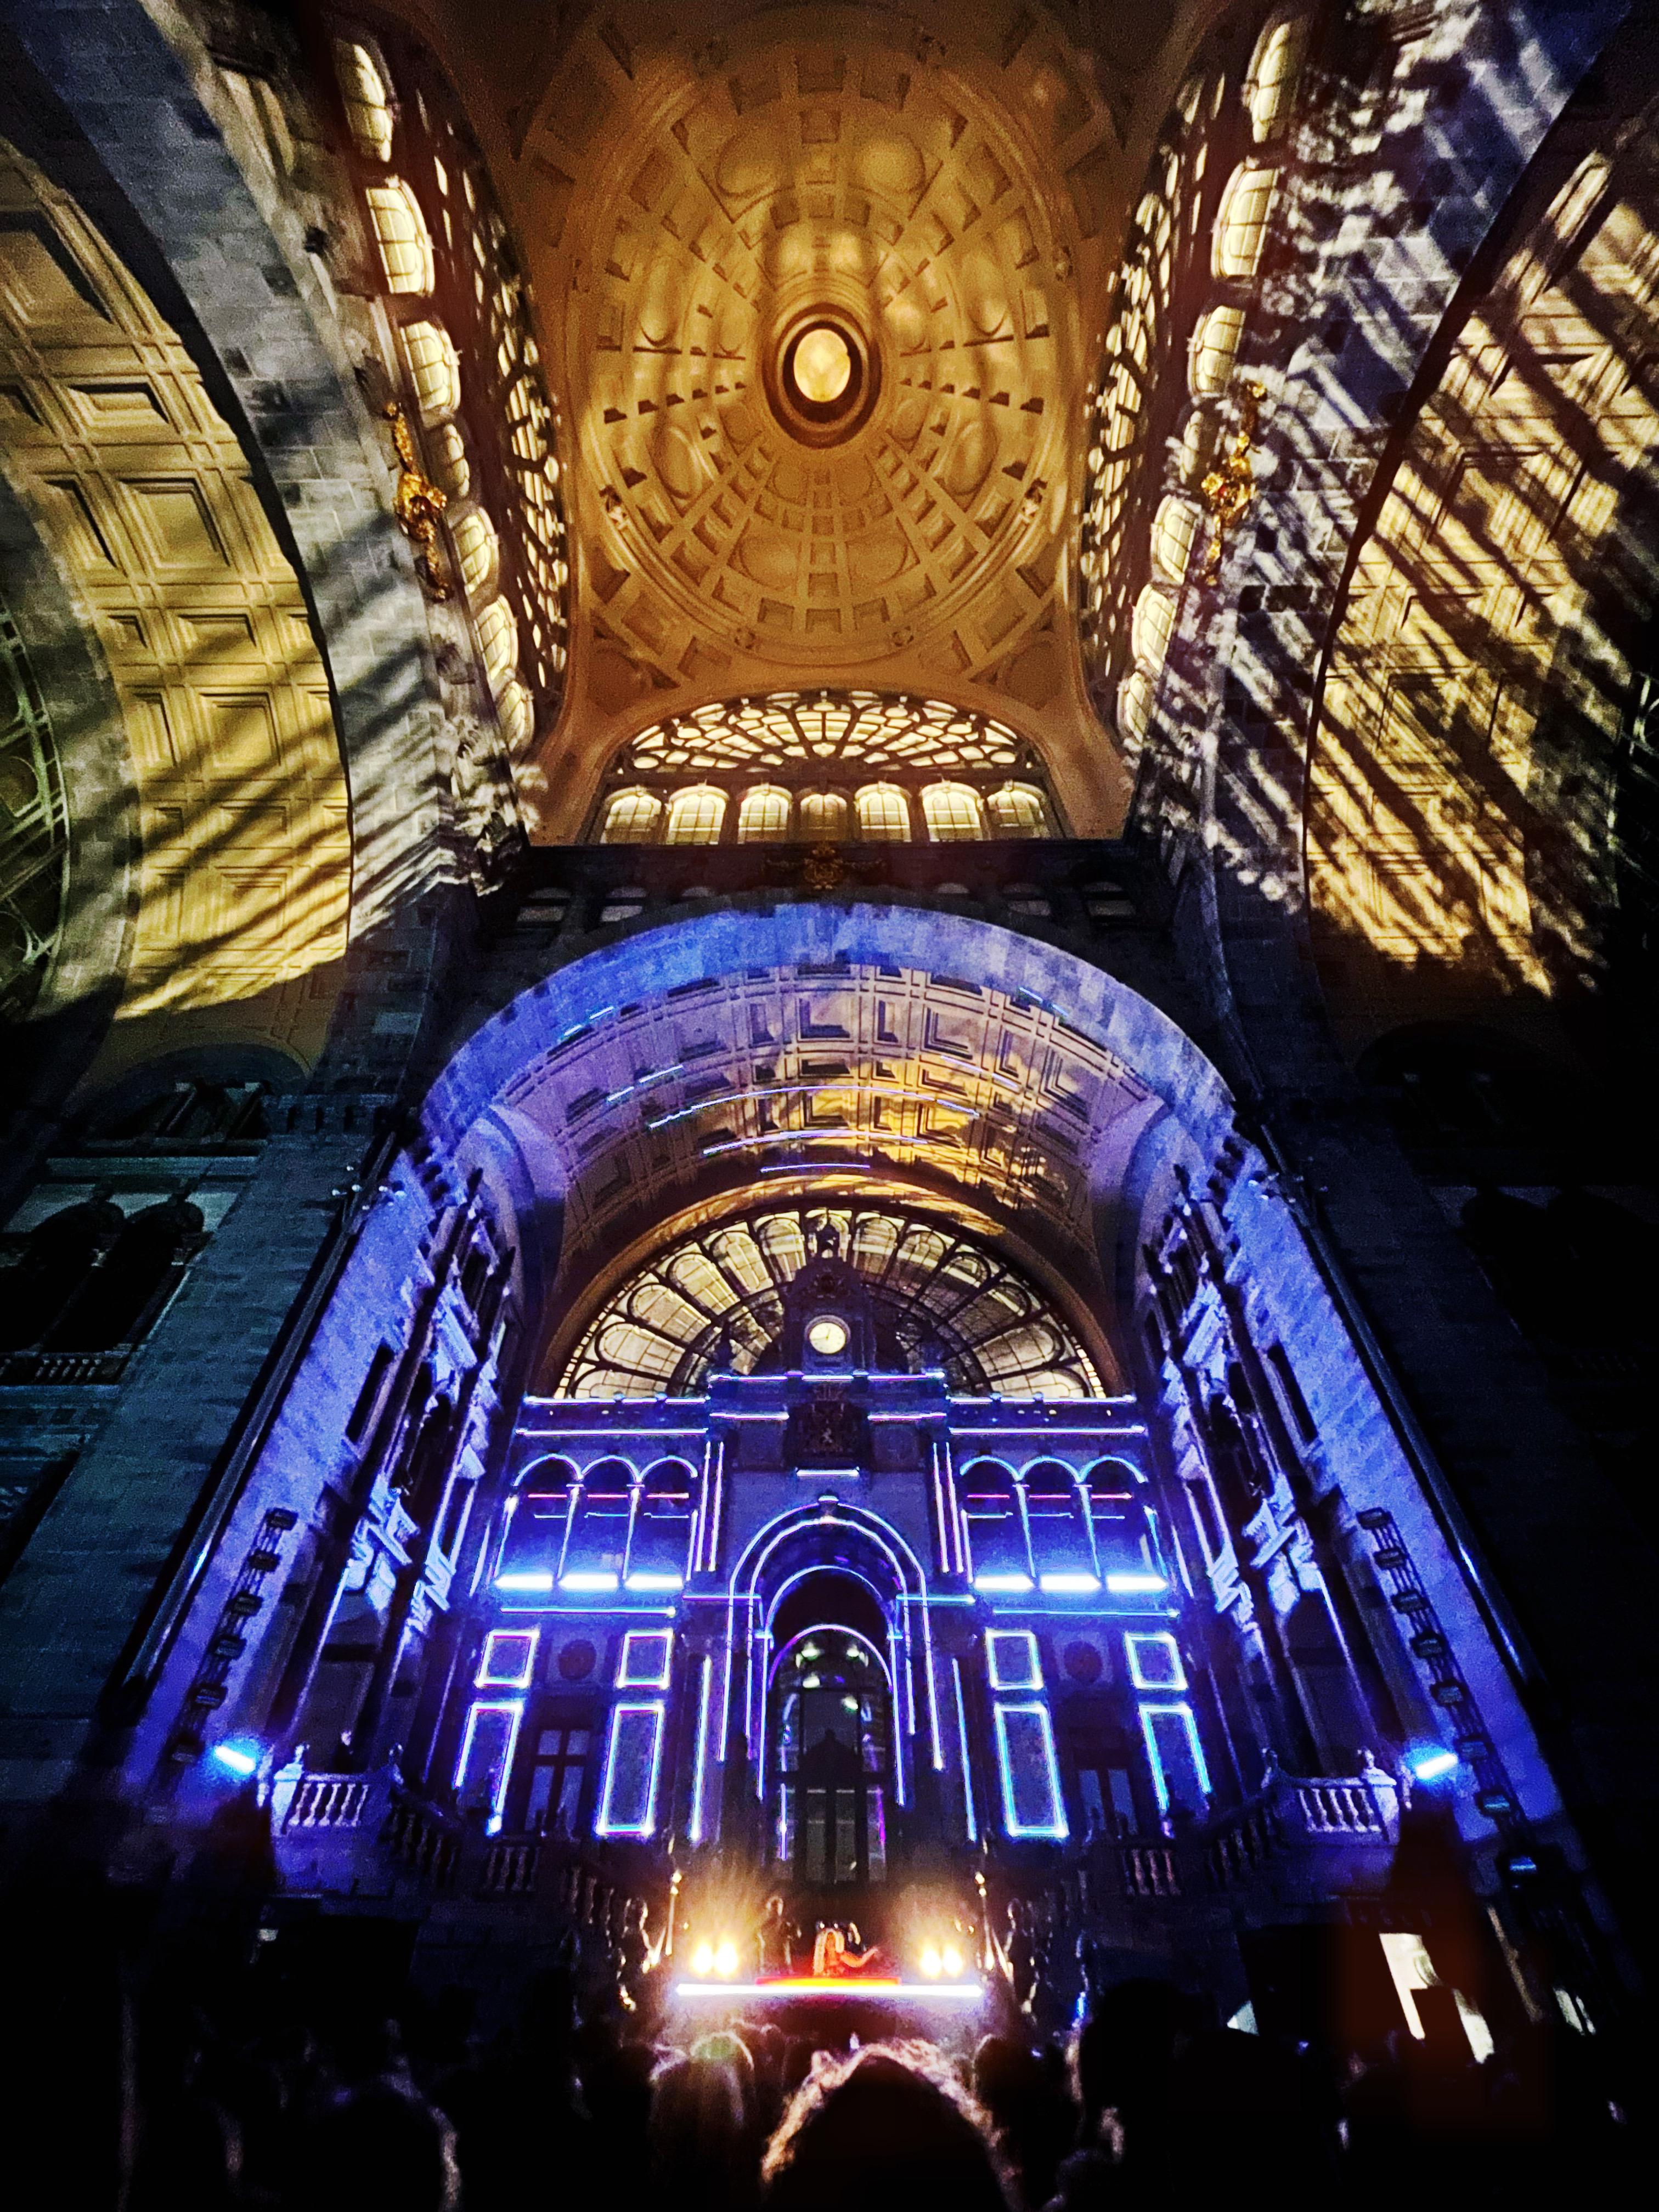
Pic by: Winnyman.com during Full Circle 2023 at Antwerp Central Station.